Introduction
This document describes the output produced by the pipeline. Most of the plots are taken from the MultiQC report, which summarises results at the end of the pipeline.
The directories listed below will be created in the results directory after the pipeline has finished. All paths are relative to the top-level results directory.
Pipeline overview
The pipeline is built using Nextflow and processes data using the following steps:
- Read QC
FastQC - Fastp to remove adapters and low-complexity reads
fastp - Mapping or reads to multiple reference genomes
Bowtie2 - Lowest Common Ancestor analysis to retain only genome specific reads
sam2lca - Taxonomic profiling of unmapped reads
kraken2 - Source predicting based on taxonic profiles
sourcepredict - Combining host and microbial predictions to calculate overall proportions.
MultiQCaggregate results of several individual modules.- Quartonotebook creates a report with sample results.
Quality control and pre-processing
FastQC
Output files
fastqc/*_fastqc.html: FastQC report containing quality metrics.*_fastqc.zip: Zip archive containing the FastQC report, tab-delimited data file and plot images.
FastQC gives general quality metrics about your sequenced reads. It provides information about the quality score distribution across your reads, per base sequence content (%A/T/G/C), adapter contamination and overrepresented sequences. For further reading and documentation see the FastQC help pages.
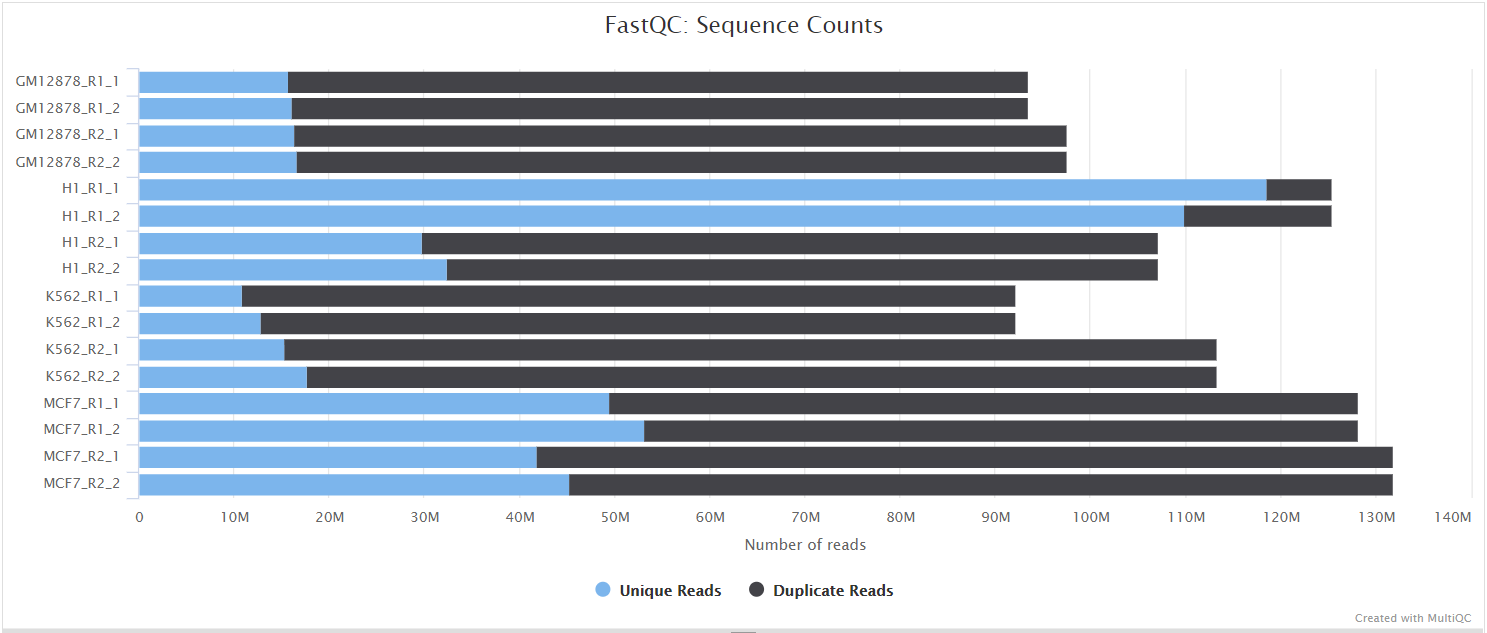
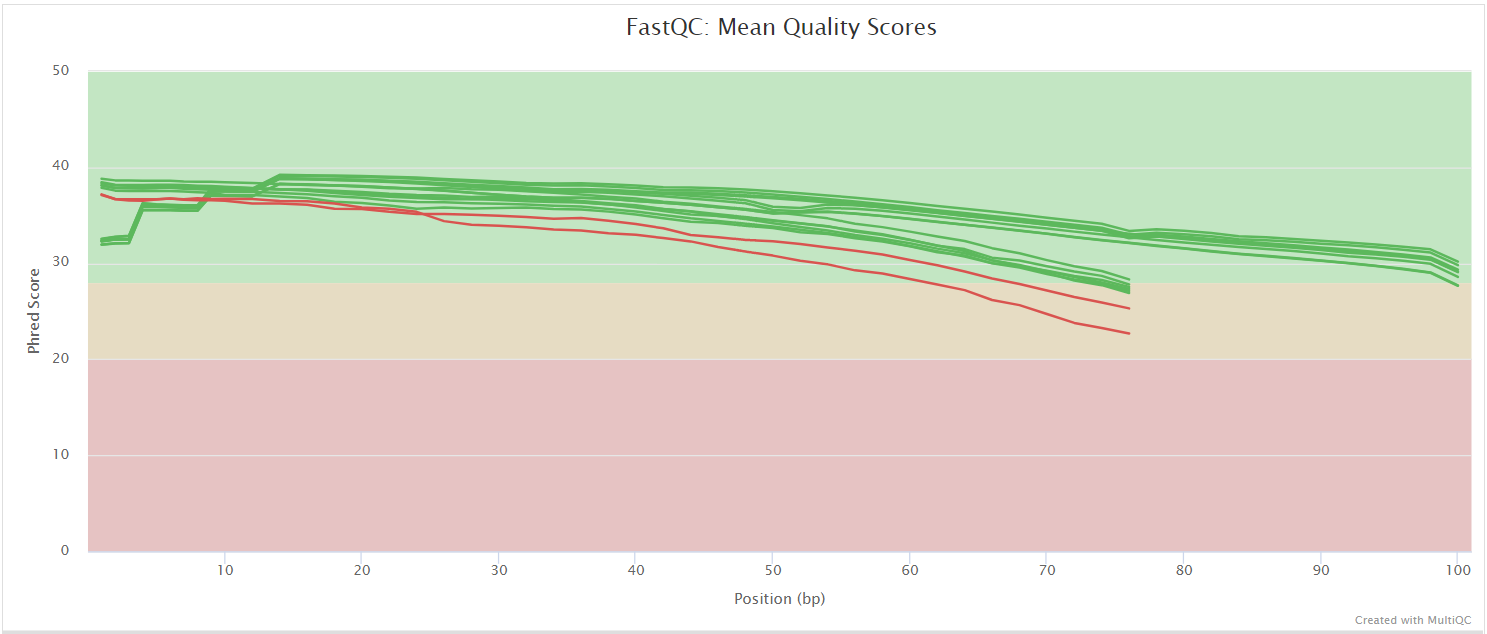
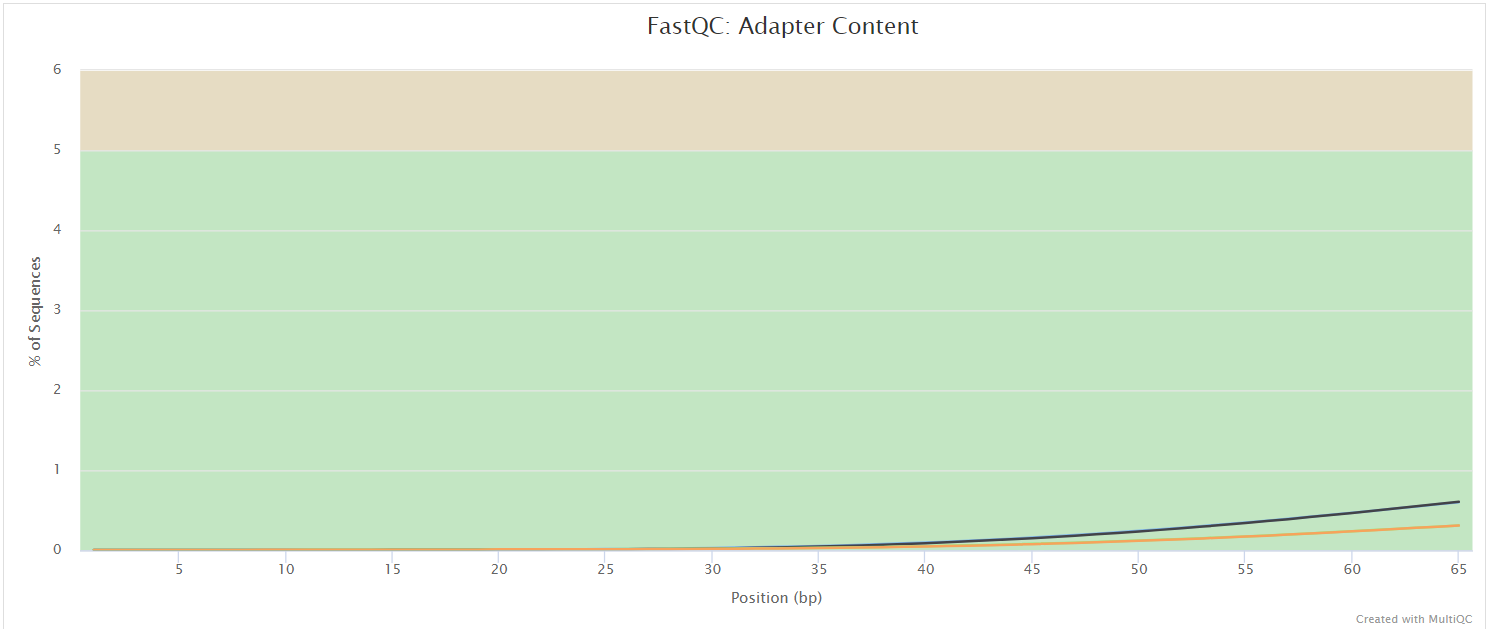
The FastQC plots displayed in the MultiQC report shows untrimmed reads. They may contain adapter sequence and potentially regions with low quality.
fastp
fastp is a all-in-one fastq preprocessor for read/adapter trimming and quality control. It is used in this pipeline for trimming adapter sequences and discard low-quality reads. Its output is in the results folder and part of the MultiQC report.
Output files
QC_shortreads/fastp/[sample]/fastp.html: Interactive reportfastp.json: Report in json format
Host DNA
Bowtie2
Bowtie 2 is an ultrafast and memory-efficient tool for aligning sequencing reads to long reference sequences. It is particularly good at aligning reads of about 50 up to 100s or 1,000s of characters, and particularly good at aligning to relatively long (e.g. mammalian) genomes.
It is used with nf-core/taxprofiler to allow removal of ‘host’ (e.g. human) and/or other possible contaminant reads (e.g. Phi X) from short-read .fastq files prior to profiling.
Output files
bowtie2/<sample_id>.bam: BAM file containing reads that aligned against the user-supplied reference genome as well as unmapped reads.<sample_id>.bowtie2.log: log file about the mapped reads.<sample_id>.unmapped.fastq.gz: the off-target reads from the mapping that is used in downstream steps.
pydamage
Pydamage is a Python software to automate the process of contig damage identification and estimation. After modelling the ancient DNA damage using the C to T transitions, Pydamage uses a likelihood ratio test to discriminate between truly ancient, and modern contigs originating from sample contamination.
Output files
pydamage/pydamage_results/:<sample_id>-<reference>_pydamage_results.csv: pydamage results per sample.
<file_prefix>.pydamage_merged_report.csv: merged pydamage results.
DamageProfiler
DamageProfiler calculates damage profiles of mapped reads and provides a graphical as well as text based representation.
Output files
damageprofiler/<sample_id>-<reference>/: directory per sample and reference with the damageprofiler results.<file_prefix>.damageprofiler_merged_report.csv: merged damageprofiler results.
Sam2lca
sam2lca analyses the Lowest Common Ancestor from a SAM/BAM/CRAM alignments. Used in nf-core/coproid to identify reference specific reads.
Output files
sam2lca/<sample_id>.sam2lca.csv: sam2lca csv report per sample, summarising the mapped reads per TAXID.<sample_id>.sam2lca.json: sam2lca json report per sample, summarising the mapped reads per TAXID.<file_prefix>.sam2lca_merged_report.csv: merged csv report of all samples.<sam2lca_acc2tax>.*: sam2lca taxonomy files.sam2lca_db/: directory containing sam2lca database files.
Microbial taxonomic profiling
Kraken2
Kraken is a taxonomic sequence classifier that assigns taxonomic labels to DNA sequences. Kraken examines the k-mers within a query sequence and uses the information within those k-mers to query a database. That database maps -mers to the lowest common ancestor (LCA) of all genomes known to contain a given k-mer.
Output files
kraken2/<sample_id>.kraken2.report.txt: A Kraken2 report that summarises the fraction abundance, taxonomic ID, number of Kmers, taxonomic path of all the hits in the Kraken2 run for a given sample.
kraken/<file_prefix>.kraken2_merged_report.csv: A combined profile of all samples aligned to a given database.<sample_id>.<kmer/read>_kraken_parsed.csv: CSV file per sample, summarising taxonomic ID and number of reads.
SourcePredict
SourcePredict is a Python package, to classify and predict the origin of metagenomic samples, given a reference dataset of known origins, a problem also known as source tracking.
Output files
sourcepredict/<file_prefix>.embedding.sourcepredict.csv: Sourcepredict embedding file, with all the PC coordinates for the PC plot.<file_prefix>.report.sourcepredict.csv: Sourcepredict report with the estimated source predictions per sample.
Reporting
Quarto notebook
A HTML report is created with Quarto, summarising the results in tables and figures.
Output files
coproid_report/_extensions/: directory with nf-core theme extensions.<file_prefix>_quarto_report.qmd: markdown report file.<file_prefix>_report.html: a standalone HTML report file that can be viewed in your web browser.
MultiQC
Output files
multiqc/multiqc_report.html: a standalone HTML file that can be viewed in your web browser.multiqc_data/: directory containing parsed statistics from the different tools used in the pipeline.multiqc_plots/: directory containing static images from the report in various formats.
MultiQC is a visualization tool that generates a single HTML report summarising all samples in your project. Most of the pipeline QC results are visualised in the report and further statistics are available in the report data directory.
Results generated by MultiQC collate pipeline QC from supported tools e.g. FastQC. The pipeline has special steps which also allow the software versions to be reported in the MultiQC output for future traceability. For more information about how to use MultiQC reports, see http://multiqc.info.
Pipeline information
Output files
pipeline_info/- Reports generated by Nextflow:
execution_report.html,execution_timeline.html,execution_trace.txtandpipeline_dag.dot/pipeline_dag.svg. - Reports generated by the pipeline:
pipeline_report.html,pipeline_report.txtandsoftware_versions.yml. Thepipeline_report*files will only be present if the--email/--email_on_failparameter’s are used when running the pipeline. - Reformatted samplesheet files used as input to the pipeline:
samplesheet.valid.csv. - Parameters used by the pipeline run:
params.json.
- Reports generated by Nextflow:
Nextflow provides excellent functionality for generating various reports relevant to the running and execution of the pipeline. This will allow you to troubleshoot errors with the running of the pipeline, and also provide you with other information such as launch commands, run times and resource usage.